Friday, November 21, 2014

Checking the Box


My wife and I married in 1976. When our first child was born in 1984 we asked ourselves a question common to young parents in America, "Where should we send our kids to school?". This was something we took very seriously, as most parents do. My parents said "why don't you move to a nice suburban school district?". In some sense, they were suggesting we do what they did in the 1960's which was to move out of the city to a middle class suburb and "check the box".  They believed if it worked for their sons, it would work for their grandchildren.

What I mean by "check the box" is that you move to a homogenous suburb of like minded people with what is considered a quality school, pay your taxes, and sleep good at night knowing you've checked the education box. Your children will do fine.  And since these were public schools, there was no cost over and above their property taxes.

As usual, we did not agree with my parents... for a number of reasons.  We both grew up in the suburbs (my wife outside of Baltimore/Washington and myself outside of Cleveland). We both disliked the suburbs for various reasons and chose to attend college in the city. We met at Carnegie Mellon University and decided to make Pittsburgh our home. We bought a house in the East End (Wilkinsburg) and have lived there for 35 years. Here's what we love about living in the city.
  • Living in a community that was socioeconomically, racially, culturally and age diverse
  • Outstanding public transportation
  • Walking to shops, movie theaters, libraries, the post office
  • The Carnegie Museums
  • The Theaters - PPT, City Theater, Pittsburgh Opera, PICT
  • The Universities
  • Schenley and Frick Park
  • Living in a very affordable 100 year old Victorian home with leaded and stained glass, oak fireplaces, wood floors, high ceilings, front and back porches and a three car garage
  • Amazing architecture
  • Wonderfully diverse restaurants
  • Relative proximity to where we worked (very short commute) 
  • Squirrel Hill, Greenfield, Southside, Shadyside, Oakland, East Liberty, Friendship, The Strip, Lawrenceville, Bloomfield, Polish Hill and all the neighborhoods
Thus began our journey to provide our children with a quality education. Our neighborhood schools in Wilkinsburg were struggling and very low achieving. They did not seem to be a viable option. As an employee of the Pittsburgh Public Schools (PPS), I had the option of sending my children to the city schools. Both of our daughters attended PPS schools - Regent Square Elementary School and Reizenstein Middle School. My eldest graduated from Taylor Allderdice High School and my youngest graduated from City Charter High School. They both received outstanding educations.

The quality of Pittsburgh education at the time depended upon what neighborhood you lived in, or what magnet school you could attend, or what program (such as gifted or scholars) your child was eligible for. Our friends confronted the same education landscape and worked hard to get it right. Most went to public schools. Some went to private schools. And some moved to get into a particular school. Some even used a relative's address to get into a particular school.
Our education journey was difficult, but doable, especially if you had financial means. It was also helpful that I was an educator so I had a deeper knowledge of the system than most parents.

It is much harder for a parent to maneuver through the urban education options in 2014. What would my wife and I do now if we had to find a school for our children?  Why is it more difficult?  Basically, the economic, population and housing trends that began when we were born continues to the present day. These trends have had a devastating effect on urban schools.


In the 1950's Pittsburgh, like Cleveland, Buffalo and Detroit, was in its heyday. Post war growth had the city's industry humming with new houses, new cars, new highways, bridges, office buildings, skyscrapers, etc. Cities were thriving. At the same time, the great American Dream was evolving. The advent of the American highway system, the proliferation of automobiles and the creation of a robust middle class provided a level of mobility never seen in our history. People began moving to the suburbs.
The Growth of Pittsburgh

The migration to the suburbs was exacerbated during the 1960's by civic unrest in the urban core. This volatile decade was highlighted by the Civil Rights movement, an anti-war movement and a labor movement that was centered in our cities. Riots in urban ghettoes, marches on university campuses, a war in Viet Nam, numerous labor strikes and four assassinations were played out on the 11:00 news. Many families began to fear urban life and those with means moved to the suburbs. The chart at the right shows the decline in Pittsburgh's populations starting in 1950.  By 1970 the city lost over 150,000 people from its height in 1950. And this was before both industrial and educational challenges raised the stakes on urban living.

From an urban education perspective, the 1970's and 1980's were the decades of integration. 20 years after the Brown v. Board of Education ruling, the courts came to the conclusion that voluntary integration would not occur. Forced busing attempted to provide equal education to all students. It was naive to think the courts could force integration. Parents fears, beliefs, biases and limited experiences were too great to overcome, in what was perceived as a court decision that overruled personal choice. Rather than integrate, many people of means moved to the suburbs.

From an urban economic perspective, the 1970's and 1980's were the decades when industry left the cities. Steel mills, automobile plants and related industries shut down and moved out. It is estimated that over 150,000 people were laid off by the steel companies in Pittsburgh in 1982-3. People left the city to seek jobs elsewhere. The people that left were either working middle class families with means who moved to the suburbs or out of work steelworkers who moved to find jobs elsewhere. This left a city with a diminished tax base, empty houses, shrinking human capital and a feeling of devastation.

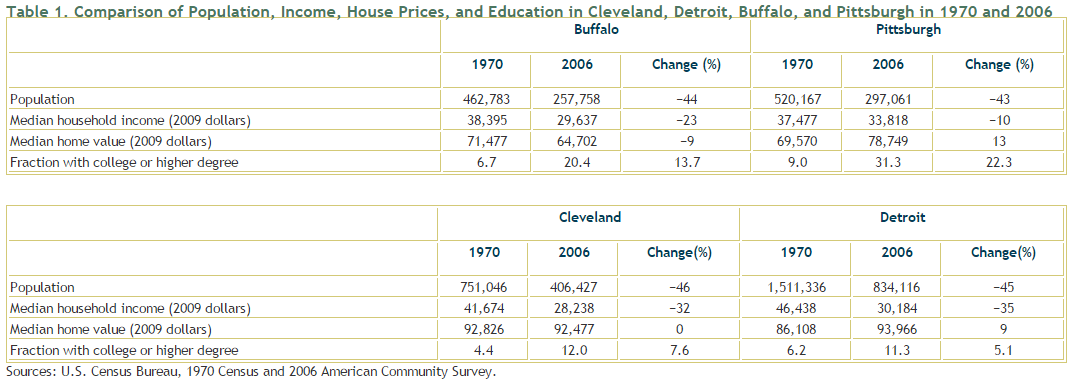
Urban Decline in Rust Belt Cities
The table above demonstrates the loss of population, the lowering of median income and the stagnant growth of housing prices that occurred from 1970 through 2006 in these four rust belt cities. This stagnancy occurred while the country, particularly in the suburbs, went through decades of constant growth and generation of wealth built on the Information Technology revolution.

Decades of unrest, loss of jobs, loss of industry, forced integration and mobility to the suburbs created an urban core that was decaying.  By 2010 Pittsburgh had lost over 50% of its population.


Edgar Thompson 

Steel Works

Then and Now...


It is not surprising therefore, that urban school districts were confronted with a complex problem. Loss of resources, working with a more needy student population and a diminished economy put the school districts at a huge disadvantage. That is what confronted parents as they attempted to choose a school for their children. So let me tell a story about what parents will do to find a quality school for their children. The year was 1987.
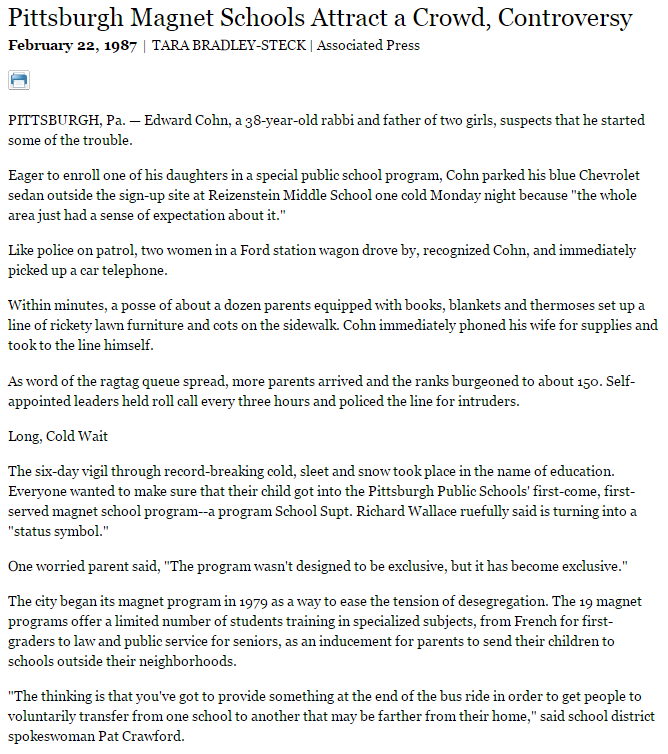
LA Times Article

The Pittsburgh Public Schools implemented a magnet program to encourage voluntary integration. The magnet schools had a special emphasis (computer science, foreign language, classical studies) and were designed to be racially balanced (50% black, 50% white). Sign up was on a first come, first served basis.

1987 Magnet Signup
Imagine... for six days and nights parents were lined up on sidewalks outside in the January cold around Reizenstein Middle School for the opening of the magnet school sign ups. A friend of mine and fellow teacher hired someone to sit in the line so that his children could attend one of the magnet schools!

This is the extent that people will go to find a quality school for their child. It also raises key points about school choice in an urban setting.  It proved that parents were willing to send their children to integrated schools... with two caveats. First, the races have to be balanced. By creating racial quotas the magnets by design were racially balanced. This was needed to get families over their fears pertaining to mixing races. Second, the fact that parents went out of their way to sign their children up for a school (rather than default to their neighborhood school) suggests that the magnet parents shared a common desire for quality education. Simply put, parents were willing to put their children on a bus, leave their neighborhood and attend a magnet school if the school was balanced racially, was of a high quality and had parents who actively made the choice to attend the school. They made this choice rather than move to the suburbs.

Imagine... waiting 6 days and nights outside in January.


So how does a parent make the decision in 2014?

Pittsburgh East End Schools - Public, Charter, Private

The chart above summarizes the current public, charter and private schools in Pittsburgh's East End. As you can see it's a daunting list. Neighborhood schools, magnets, partial magnets, charters, parochial ($4,000-18,000 per year), university schools ($13,000 per year) and private schools ($16,000 - 28,000 per year). And if you have more than one child, the cost to go to private schools doubles or triples.

It is not surprising that there is a huge amount of variability between these schools. Some are all white... some are all black.  Some are poor... and some are wealthy. And some are diverse. Some produce amazing student achievement, and some are the lowest in the state. The variation of schools in both the city and the suburbs suggests that education in America is balkanized.  So we are back where we started... the burden is on the parent to figure it out and get the best education for their child. Thus, more and more people choose to "check the box" and move out of the city to an affordable suburban school district.

I have an adage that I subscribe to. People, parents, politicians do a lot of talking. They talk as if they are conservative or liberal, reactionary or radical, libertarian or tea party.  I don't listen to what they say. I watch where they send their children to school. People don't gamble with their children. They shouldn't. But they do select schools based on their biases, their fears, their experiences and sometimes, what's easy.  I can make an argument for "checking the box" and attending a suburban school from a variety of perspectives. Free education. A relatively good quality. Convenience.

As is true of any school choice there are drawbacks as well.  Suburban schools were always considered safe, but that is less true now (see The Evolution of Violence in Schools.) And in suburbia, conformity is the norm. It can be a difficult passage through a suburban school if you are a special needs child, or have ADHD, or are in a small minority (race, religion, ethnicity, sexual orientation). But as long as you fit in, your parents can "check the box".

I am suggesting that parents who want to live in the city should engage in their child's education, stay in the city and help make our schools better. Education is so much more than learning the essentials (reading, writing and arithmetic). It is about learning how to collaborate, becoming tolerant of individual differences, gaining value from diversity and different points of view. It is about becoming culturally aware through museums, libraries, architecture and the arts. It is about experiencing the culture of other religions, races, classes and ethnicities. It is about becoming part of a greater community, society, country and world. And you can get a rigorous academic experience if you work at it.

You are fooling yourself if you move to a suburban school and all you do is check the box. You are fooling yourself if you send your child to any school and all you do is check the box. In America, a child's education is determined by their parent, not the government.

I finish with a recent letter to the editor in the Post-Gazette. The letter was sent by a colleague of mine and an excellent teacher I worked with at City High. She talks about her struggle to find a quality school for her son. And she does a superb job of articulating the broader issue. By no means could she be accused of "checking the box."

Woodland Hills’ history shows parents can demand quality 
As a parent of a student in the Woodland Hills School District and as an educator, I read with interest “Woodland Hills Strives and Struggles to Achieve Equality” (Oct. 5). Most compelling was that the initial drive to ensure an equal education for all students came not from politicians or educators but from parents.
My husband and I have struggled since our son neared the end of his preschool years to determine the best educational choice for him from myriad options: public, private or charter, homeschooling or unschooling. Some counseled that we move, others that we budget to allow for a private education. We entered charter lotteries and bore the disappointment of waiting lists.
Through it all, two things remained constant. One is that we have been consistently impressed and grateful for the remarkable talents and professionalism of the teachers and administrators at Woodland Hills. Another constant is our belief that it is not just our child but our neighbors’ children, who all deserve a quality education. We may pick up and move; we may scrimp to afford a private school education, but what about the families who may not have those options available to them?
Families must make the decisions that they can live with and that work best for them. I look for my inspiration to the families who fought for the original desegregation order for providing a model of how dedicated parents can organize and demand a rigorous and enriching education for all students.
(Post-Gazette, Oct. 15, 2014)

Friday, November 14, 2014

Special Education

A few weeks ago, I attended a conference at the University of Pittsburgh on the education of African-American males. Out of the clear blue a parent stood up and stated "the problem is Charter Schools are taking special education funding from the school districts and not using it appropriately. They need to give the excess funds back."  Where did that come from?
Shameless Lobbying by Charter Schools Jeopardizes Solid Special Education Reform (Lower Macungie Patch, May 26, 2014)
Our Missing $200 Million (Yinzercation, May 30, 2014)
Critics are stating that Charter Schools receive more special education funding than they need and are using the funds for other purposes. Excess funds should be returned. On the surface this seems to make great sense. But it actually is a red herring. It has everything to do with the Special Education funding formula and nothing to do with Charter Schools. Let's spend some time finding out how Special Education is funded in Pennsylvania.

Federal Legislation


Special Education (i.e. providing individualized education services to students with identified disabilities) is a relatively new phenomenon in the United States. Here is a quick timeline of events (Source 1).
1961 - President Kennedy creates the President’s Panel on Mental Retardation. The panel’s recommendations includes federal aid to states. 
1965 - President Johnson signs the Elementary and Secondary Education Act (ESEA), which provides funding for primary education, and is seen by advocacy groups as expanding access to public education for children with disabilities. In spite of these two initiatives, little changes occurred in public education regarding meeting the needs of students with disabilities.  
1975 - Two federal laws were passed that provided the legal basis for our current special education program.  The Education for All Handicapped Children Act (EHA) established the right to public education for all children regardless of disability.  The Individuals with Disabilities Education Act (IDEA) required schools to provide individualized or special education for children with qualifying disabilities. Under the IDEA, states who accept public funds for education must provide special education to qualifying children with disabilities.
The concept of Special Education was operationalized via the 1975 federal EHA and IDEA legislation.

Pennsylvania Funding


A HIstory of Special Ed Funding (Source 2)
In 1975 Pennsylvania was committed to providing 50% of all regular education costs to local school districts. When the federal government passed these two laws, Pennsylvania created a Special Education funding formula based on need. The Excess Cost System meant the state funded Special Education based on the actual per student cost of providing services over and above regular education costs. Thus every district received adequate funding to meet their Special Education needs. This was a huge commitment on the part of the state.

I entered public education as a teacher in 1975.  In Upper St. Clair HS (where I taught for two years) and in the Pittsburgh Public Schools (where I worked for 23 years), Special Education classes were pull outs - meaning special needs students were taught in isolated rooms by certified special education teachers. The state provided funding for each student that was identified. Providing per student funding actually created a financial incentive to identify students with disabilities. As the chart above suggests, in practice this type of funding, although adequate to meeting the demand, incentivized taking students out of the regular education population. My experience in Pittsburgh found that special education classes were overwhelmingly filled with black males. In a very cynical (and racist) way, this seemed like a "win-win" for the district.

In 1983, the state of Pennsylvania changed it's funding formula for school districts. They repealed their commitment to fund at the 50% level. High inflation, loss of jobs/industry, growing special education costs and a conservative backlash against taxes created revenue shortfalls. The funding levels dropped consistently over the next 20 years to a low of 36% in 2006 (Source 4).

A HIstory of Special Ed Funding (Source 2)
In 1991, the state decided to change its Special Education funding formula in order to save money. The new formula assumed that 15% of a given school population had a "mild disability" and 1% had a "severe disability". Based on these assumed proportions, the state provided a consistent revenue stream to fund special education for local districts.  This model was predicated on the belief that all districts have the same proportion of special needs students.  As one can imagine, the new funding formula had two important ramifications.

First, it created an incentive not to identify students for special education. Since the funding was fixed, the less students with special needs the better. Thus there was a financial disincentive to test students for disabilities. Although this is a very cynical and unethical consequence, evaluation decisions at the administrative level were often made through a funding filter.

What Causes Learning Disabilities
Second, the new funding formula gave too much money to certain districts and too little money to others. If your district had only 10% special needs students than the district kept the additional money and spent it any way they wanted to. Sound familiar?

If the district had more than 16% special needs students, than the district did not have enough money to provide services for its students. They would have to make up the difference with local funds or not provide services (which is against the federal law). It is not a surprise that districts with higher levels of poverty have higher percentages of special needs students (note the three possible contributing factors to learning disabilities in the chart at the right.)

So it was the 1991 Special Education funding formula that created the system that provided excess funds to some districts.  And these excess funds did not have to be returned. There was very little complaining about excess funding before the existence of Charter Schools. The main complaint pertained to the fact that state funding in general was shrinking.  It is hypocritical for critics of Charter Schools to demand that they pay back excess special education funds when they never asked the rich suburban districts who have received excess funds since 1991 to return those funds to the state. But then again, many of those critics live in the suburbs and send their children to suburban schools.

In 2013 the State of Pennsylvania commissioned a report on special education funding including recommendations for a new formula. The published report attempts to fix the formula by addressing factors such as severity of disability, poverty, local conditions, etc. The report has been published but the recommendations have not yet been made into law.


Special Education Expenditures at the School Level


At the school level, Special Education funding is often a tale of two extremes.  A case study from my experience as a Charter School principal points out how complex special education funding can be.

School districts complete a PDE Form 363 to determine the tuition they must provide to Charter Schools per student.  In Pittsburgh for the 2014-15 school year, the district will provide a Charter School with $12,402.91 (PA average is $9717.99) for every regular education student and $27,270.14 (PA average is $20,270.12) for every special education student. This means that the charter receives an additional $14,876 (PA average is $10,552.12) for each special education student. That's a lot of money.

As one would guess there are different levels of expenditure based on each student's individual needs.

Low Cost Extreme: Every year our school has a few students who have a speech and/or a hearing disability. As per the special education guidelines, the student's Individualized Education Program (IEP) articulates how the school, student and parent are going to address the disability. First, a complete evaluation of the student is conducted often by a third party psychologist. Second, once the IEP is written based on the evaluation and agreed to by all parties, primary services may include working with a speech therapist throughout the year. This is accomplished through an itinerant certified speech teacher who works for the local Intermediate Unit. The teacher will work with the student as needed for the entire school year. Third, support services are provided to the student by both a special education teacher and the regular education teachers in the regular education classrooms (least restrictive environment.) This type of intervention, due to the minimal severity of the disability, might only cost an additional $5000 in expenditures. Thus, according to the critics of Charter Schools, our school netted  $9,876 ($14,876 - $5000) and should have to pay it back to the district.

High Cost Extreme: Every year our school has a few students with severe disabilities. An example would be a student with multiple disabilities such as an intellectual disability (60 IQ) in addition to a speech and learning disability. Many schools or smaller districts are not able to adequately support students with severe or multiple disabilities within their program. In this case, our school works with the parent to conduct a full psychological evaluation to create the IEP.  The IEP may call for wrap around comprehensive services that can only be provided at schools specific to working with severely disabled students. We work with the parent to locate a mutually agreed to facility that meets the child's needs and is welcoming to the family. Once the child is accepted into that facility's program, we pay for the students tuition and transportation. We work with the school on the annual IEP, follow the student's progress and work with the parent to obtain support services as needed. A recent example for such a student cost our school over $90,000 per year (for 4 years).  Believe it or not, the highest part of the cost was for daily transportation from home to the facility.  In this case, our school was spending $62,730 ($90,000 - $27,270) more than the allocation it received.

As you can see, a number of students with high cost extreme disabilities can tax a school's budget. Extra costs from one student help to defray costs from another. It should be noted that every attempt was made to work with our chartering school district (the Pittsburgh Public Schools) to share transportation costs.  Essentially, PPS was transporting their students to the same private school, but was unwilling to work with our school to share the transportation. This would have saved the district money and our school money since we would have shared the costs. Since they were not willing to work with us, we had to transport the student spending large amounts of money that could have been saved.

The Takeaway


Cost balancing of special education funding occurs in every school and every district in Pennsylvania.  Some districts spend more than they receive and others net gains that are spent on programs outside of special education.  Or they choose to carry the net gain to the following year in case they need to serve students with high cost extreme disabilities.

Since 1983, the state has funded regular education in a manner that shows a clear lack of support - lowering its funding from 50% to 36%.  As the state lowers its funding for education, the local districts must make up the difference. This leads to local funding where wealthier districts provide more and better resources than poorer districts (i.e. education inequality.)

Since 1991, the state has funded special education in a manner that is cynical, simple minded and benefits the haves... not the have nots.  This occurred under both Democrat and Republican governors, and a Republican legislature.  I have already commented on the funding inequities in my blogpost - To learn about education in Pennsylvania... Follow the money!

The often cynical and unethical behaviors by district administrators to manage their special education identification and programming based on financial incentives or disincentives is terribly distressing.  Whether this occurs in rich suburban school districts, poor urban districts or charter schools, it is wrong.

As a society, we should be committed to quality education for all students.  A first step would be for the state level to legislate the recommendations made by the 2013 Special Education Funding Commission.

It also might be a good idea if the watchdog groups, such as the Pennsylvania Federation of Teachers, the Pennsylvania Education Association, Yinzercation and Great Schools - Pittsburgh, took some of the effort they put into complaining about funding and used that effort to monitor District and Charter special education programs to see how successful they are. The critics want to talk about money. We should be talking about creating successful models with our special needs population.

I am very proud of the efforts that City High has made regarding special education. Below you will find a few measures from City Charter High School's Annual Report regarding special education. City High recently went through a successful state audit of its special education program in which the schools program was described as "exemplary".

City High special education students graduate with:
  • similar GPA's (90% with 2.0 or higher) to regular ed students;
  • similar number of Microsoft certifications (3 - 5) to regular ed students;
  • similar grades on graduation projects (71% A or B) to regular ed students;
  • similar grades on external internships (90% A or B);
  • higher ratings on school attitudes and experiences (see following chart).  


So let's finish the money talk. Let's say a charter school has excess special education money at the end of the year. And let's say they gave it back to the school district. What would the district do with it? Would they give it back to the taxpayers? Would they send a check back to the state? Would they spend it on their existing special education students? Or would they allocate it to other purposes?

What's your guess?


Sources on Pennsylvania School Funding

1. The History of Special Education in the United States
http://www.specialednews.com/the-history-of-special-education-in-the-united-states.htm

2. A History of Special Education Funding in PA 
http://reformspecialedfunding.org/wp-content/uploads/2009/05/paspecialedfundinghistory.pdf

3. The History of School Funding in PA

4. A History Public School Funding in Pennsylvania

Friday, November 7, 2014

Measuring Quality

Every public school educator fears the day when they open up the morning newspaper and reads the headline. The state scores were announced and your school is going to be judged by a limited number of factors, mainly a single score on a Reading,Mathematics and Science test. What percentage of your students were Proficient?  And how did your scores compare to the surrounding school districts?

Every parent fears the day when their child, who had good grades in school, opens the letter from the College Board and sees their SAT or ACT scores.  Are the scores low, too low for the college he/she wants to attend?  Are they too low considering his/her good grades?

Every student fears the moment they get their final exam, their chapter test, quiz, writing assignment, etc. back and sees a score that is low.  Imagine how it feels if the tests are handed back in order from highest to lowest.

Test scores have become the default mechanism for determining whether a school, student or teacher is doing well.  I completely understand why one would want a measure for comparing the quality of schools.  And I understand the need to evaluate student progress and achievement.  Yet a single test score does not come close to describing either.  So what is the alternative?

When we opened City Charter High School, we contracted with an outside education evaluator, Dr. Catherine Nelson, to help us develop a comprehensive evaluation tool for the school.  We call it our Annual Report Card and it is shared with our staff, our Board and with the community.

This year's annual report is 45 pages long. Some of it would apply to any public school, some to just high schools and some just to unique programs at City High. The point is that we are providing the public with a comprehensive methodology for evaluating the quality of our school.

The Report Outline (above) focuses on the 10 domains where we gather data. Each domain has various measures that provide input to stakeholders including parents, teachers, students, the Board, the chartering school district, the state, etc.

Examples of data from the City High Report follow. They are intended to provide the reader with a broader context  for measuring quality in schools. I have chosen one item per domain. If you'd like to look at all the measures go to the City High website and read the report online or download it.


I. Student Achievement: This graph provides Keystone test data for City High.  The Keystone exams are Pennsylvania's assessment used both to determine individual student proficiency and to measure school performance. The value of showing the data in this format is that it provides school level data for both Algebra and Literature, compares the data for 2013 and 2014 and baselines the data with the 2019 state goal.  Other measures for student achievement include, but are not limited to, QPA's, portfolios, presentations, certifications, college readiness scores (SAT/ACT) and student improvement data (PVAAS).

City High Keystone Results


II. Independent Learning: This is a domain that predicts success in both postgraduate education and the job market. Most schools never report data in this category.  The chart below is a student rating which provides feedback on where the student feels they stand in this domain. Other charts in the report provide teacher ratings on the same skills.  This rating is watched over time (both as students go from Freshmen to Seniors and as the school grows in its ability to create independent learners.) Other measures of independent learning include evaluation of graduation projects, independent science projects and teacher surveys.  


III.  Workforce Skills

Since the ultimate measure of K12 school quality is success after graduation, it would be wise to measure workforce skills. These "soft skills" include problem solving, collaboration, time management, project management and communication skills. All students at City High participate in a graded, heavily evaluated 130 hour external internship. The chart below provides data on both successful completion of the internship (grade) and host satisfaction with the intern. Another measure of workforce skills the school uses is the average number of Microsoft certifications for the graduating class.  

IV. Post High School Transitions  

This is another domain associated with post graduation success.  The graph below shows longitudinal data on Pittsburgh Promise eligibility (Pittsburgh's college scholarship program.) Note the graph provides 5 years of data, broken  out by race and using the Pittsburgh Public Schools aggregate data as a baseline.  Other measures include graduation rates, success in college, plans for transitioning after graduation, higher education placement and student surveys of their preparation for the transition.  


V. Teacher Quality and Growth

Teacher quality is one of the key factors in a quality School That Works.  The data for the chart below comes from the annual survey of teachers.  Other measures of teacher quality and growth include % certified, degree attainment, promotions in a given year, opportunities for growth and how planning time is used.  Some data comes from surveys and some from employment history. Teacher attendance and turnover are also measured.  

VI. Parent Satisfaction/Engagement

Parent Satisfaction and Engagement are key elements in a quality school's success. The chart below is a measure of overall parent satisfaction.  Note that the chart uses a national baseline for comparison. These figures are also kept longitudinally to look for year to year trends. Other measures in this category include measures of the school's responsiveness to parents needs, parental use of the online student information system and satisfaction with various aspects of the school program.  

VII.  Curriculum and Instruction

It is not easy to measure the quality of curriculum and instruction in schools.  Often this entails many classroom observations and analysis of books, courses of study and implementation strategies. However, some basic information can be collected via student surveys pertaining to classroom activities, personalism and differentiated instruction.  Simple measures such as the number of instructional hours in a year, especially when baselined against state minimums is valuable.  The chart below measures students perception of classroom personalism and it is baselined against a study in the Chicago Public Schools (CPS).


VIII.  Special Education

Questions pertaining to a school's special education program often focus on the level of inclusion, classroom achievement and transitioning to post high school training, education or work. Note in the following graph that the achievement gap between regular ed students and special ed students was eliminated in 3 years.  


IX. School Climate

Measures of school climate pertain to student success, student/teacher retention, attendance, alignment with core values, quality relationships and trust.  These are often measured by determining whether students and staff are in attendance, remain in the school for four years and feel the school is supportive.  Attendance/Retention/Promotion data is used as well as surveys of all members of the school community.  


X. Leadership

One of the most important areas to measure is school leadership.  Satisfaction ratings from faculty and parent surveys are key.  Leadership turnover is an important element to look at.  A board evaluation of the Leadership team is conducted annually.  


An argument can be made that a 45 page annual report is too much to ask any parent to work through to determine whether a school works or not.  Two years ago the State of Pennsylvania began providing the public with a School Performance Profile (SPP) for every school in the state. The state takes test scores, test improvement, graduation rates and attendance rates to come up with a single number to describe the quality of each school.  In 2012-13 our SPP number was 81.2 out of 100.  Compared to urban high schools in Pennsylvania that makes us one of the best.  Compared to wealthy suburban school districts in Allegheny County that score puts us in the middle of the pack. One number. How good is your school? 81.2.

Whether we like it or not, we live in a country whose educational system is essentially based on school choice.  Where you go to school is determined by where you choose (or can afford) to live, or where you purchase an education (private, Catholic) or if there is a charter school or magnet school you can attend. Parents are desperate to get their students into a quality school. If you don't trust a single number such as the SPP or you don't have access to a comprehensive report on the school, here are a few common sense suggestions.

1. Visit the school and take a tour.  Make sure you go into classes, the cafeteria and the administrative offices.  Listen to what your tour guide points out.  What is the culture of the school?  What do they value?  Are they focused on academics, extracurriculars, the physical plant or the football team?  

2. Watch the people.  Are students engaged?  Are teachers actively helping students individually?  Are people happy... or miserable?  

3. Talk to a student.  Ask him/her what are you working on?  What have you learned about this subject? 

4. When you are in classrooms, filter what you see through the lens of equity.  Do boys and girls get called on equally?  Does the seating chart appear to put a specific group of students together (for example... active boys in the back, or all the black students together?)  Does the school do tracking where some students are not able to participate in academic classes?  

5. Look at the physical aspects of the school.  What is on the walls? What information greets you as you enter the building?  Is there a metal detector? Is it an athletic awards cabinet? Or is it about academic achievements? Colleges attended?  Graduates and Alumni?  Is the school clean?  Go into a bathroom. See if it is well maintained.  

6. Talk to neighbors who had students who recently went through the school.  How were their children prepared?  Ask their children about their experience.  Ask them if they had to do it over again would they send their child to the school.    

7. Observe the school cafeteria or end of the day dismissal.  Watch how the school handles students in transition. Is there adequate guidance?  Are the students responsible and well behaved or is it pandemonium?  

8. Ask about Special Education.  Does the school do a pull out or an inclusion program?  Ask about the transition planning for high school juniors/seniors who have an IEP.  See if you can talk to the Special Education coordinator.  

9. Look at the assignments and notes on the board.  Look at the vocabulary.  Look at the problem sets.  Is the focus on simple minded basic skills or is it challenging work?  Is there an indication that students work on in depth projects?

10. Look at the state test scores for all subgroups.  This means don't just look at how the school did as a whole.  But look at how Title I students did, or Special Education students did, or students of color.  Look at achievement gaps.

11. Talk to the Principal.  See if he/she talks about what the school has to offer or whether the focus is on how the school measures its success... with all students.

12. Find out what kind of Support Services are offered.  Is there a nurse, social workers, college counselors, a place for students to seek out help?  

Measuring quality is very important.  Simplifying it to a single number or a test score is foolish. Whether we like it or not, our society expects parents to choose the best for their children; no matter what the child's circumstances.  Assuming that you can send your students to the local community school and receive a quality education is not guaranteed.  

All schools are not equal.