 Every public school educator fears the day when they open up the morning newspaper and reads the headline. The state scores were announced and your school is going to be judged by a limited number of factors, mainly a single score on a Reading,Mathematics and Science test. What percentage of your students were Proficient? And how did your scores compare to the surrounding school districts?
 Every parent fears the day when their child, who had good grades in school, opens the letter from the College Board and sees their SAT or ACT scores. Are the scores low, too low for the college he/she wants to attend? Are they too low considering his/her good grades?
Every student fears the moment they get their final exam, their chapter test, quiz, writing assignment, etc. back and sees a score that is low. Imagine how it feels if the tests are handed back in order from highest to lowest.
Test scores have become the default mechanism for determining whether a school, student or teacher is doing well. I completely understand why one would want a measure for comparing the quality of schools. And I understand the need to evaluate student progress and achievement. Yet a single test score does not come close to describing either. So what is the alternative?
 When we opened City Charter High School, we contracted with an outside education evaluator, Dr. Catherine Nelson, to help us develop a comprehensive evaluation tool for the school. We call it our Annual Report Card and it is shared with our staff, our Board and with the community.
This year's annual report is 45 pages long. Some of it would apply to any public school, some to just high schools and some just to unique programs at City High. The point is that we are providing the public with a comprehensive methodology for evaluating the quality of our school.
The Report Outline (above) focuses on the 10 domains where we gather data. Each domain has various measures that provide input to stakeholders including parents, teachers, students, the Board, the chartering school district, the state, etc.
Examples of data from the City High Report follow. They are intended to provide the reader with a broader context for measuring quality in schools. I have chosen one item per domain. If you'd like to look at all the measures go to the City High website and read the report online or download it.
I. Student Achievement: This graph provides Keystone test data for City High. The Keystone exams are Pennsylvania's assessment used both to determine individual student proficiency and to measure school performance. The value of showing the data in this format is that it provides school level data for both Algebra and Literature, compares the data for 2013 and 2014 and baselines the data with the 2019 state goal. Other measures for student achievement include, but are not limited to, QPA's, portfolios, presentations, certifications, college readiness scores (SAT/ACT) and student improvement data (PVAAS).
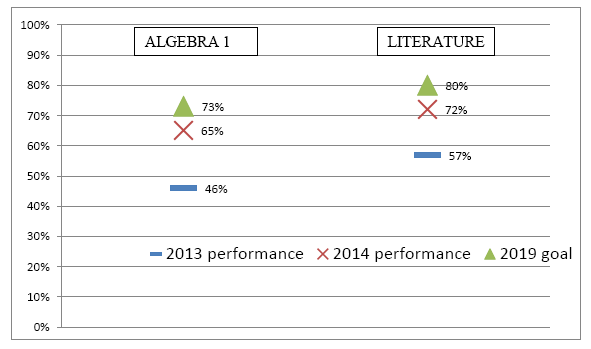 |
| City High Keystone Results |
II. Independent Learning: This is a domain that predicts success in both postgraduate education and the job market. Most schools never report data in this category. The chart below is a student rating which provides feedback on where the student feels they stand in this domain. Other charts in the report provide teacher ratings on the same skills. This rating is watched over time (both as students go from Freshmen to Seniors and as the school grows in its ability to create independent learners.) Other measures of independent learning include evaluation of graduation projects, independent science projects and teacher surveys.

III. Workforce Skills
Since the ultimate measure of K12 school quality is success after graduation, it would be wise to measure workforce skills. These "soft skills" include problem solving, collaboration, time management, project management and communication skills. All students at City High participate in a graded, heavily evaluated 130 hour external internship. The chart below provides data on both successful completion of the internship (grade) and host satisfaction with the intern. Another measure of workforce skills the school uses is the average number of Microsoft certifications for the graduating class.

IV. Post High School Transitions
This is another domain associated with post graduation success. The graph below shows longitudinal data on Pittsburgh Promise eligibility (Pittsburgh's college scholarship program.) Note the graph provides 5 years of data, broken out by race and using the Pittsburgh Public Schools aggregate data as a baseline. Other measures include graduation rates, success in college, plans for transitioning after graduation, higher education placement and student surveys of their preparation for the transition.

V. Teacher Quality and Growth
Teacher quality is one of the key factors in a quality School That Works. The data for the chart below comes from the annual survey of teachers. Other measures of teacher quality and growth include % certified, degree attainment, promotions in a given year, opportunities for growth and how planning time is used. Some data comes from surveys and some from employment history. Teacher attendance and turnover are also measured.

VI. Parent Satisfaction/Engagement
Parent Satisfaction and Engagement are key elements in a quality school's success. The chart below is a measure of overall parent satisfaction. Note that the chart uses a national baseline for comparison. These figures are also kept longitudinally to look for year to year trends. Other measures in this category include measures of the school's responsiveness to parents needs, parental use of the online student information system and satisfaction with various aspects of the school program.

VII. Curriculum and Instruction
It is not easy to measure the quality of curriculum and instruction in schools. Often this entails many classroom observations and analysis of books, courses of study and implementation strategies. However, some basic information can be collected via student surveys pertaining to classroom activities, personalism and differentiated instruction. Simple measures such as the number of instructional hours in a year, especially when baselined against state minimums is valuable. The chart below measures students perception of classroom personalism and it is baselined against a study in the Chicago Public Schools (CPS).

VIII. Special Education
Questions pertaining to a school's special education program often focus on the level of inclusion, classroom achievement and transitioning to post high school training, education or work. Note in the following graph that the achievement gap between regular ed students and special ed students was eliminated in 3 years.

IX. School Climate
Measures of school climate pertain to student success, student/teacher retention, attendance, alignment with core values, quality relationships and trust. These are often measured by determining whether students and staff are in attendance, remain in the school for four years and feel the school is supportive. Attendance/Retention/Promotion data is used as well as surveys of all members of the school community.

X. Leadership
One of the most important areas to measure is school leadership. Satisfaction ratings from faculty and parent surveys are key. Leadership turnover is an important element to look at. A board evaluation of the Leadership team is conducted annually.

An argument can be made that a 45 page annual report is too much to ask any parent to work through to determine whether a school works or not. Two years ago the State of Pennsylvania began providing the public with a School Performance Profile (SPP) for every school in the state. The state takes test scores, test improvement, graduation rates and attendance rates to come up with a single number to describe the quality of each school. In 2012-13 our SPP number was 81.2 out of 100. Compared to urban high schools in Pennsylvania that makes us one of the best. Compared to wealthy suburban school districts in Allegheny County that score puts us in the middle of the pack. One number. How good is your school? 81.2.
Whether we like it or not, we live in a country whose educational system is essentially based on school choice. Where you go to school is determined by where you choose (or can afford) to live, or where you purchase an education (private, Catholic) or if there is a charter school or magnet school you can attend. Parents are desperate to get their students into a quality school. If you don't trust a single number such as the SPP or you don't have access to a comprehensive report on the school, here are a few common sense suggestions.
1. Visit the school and take a tour. Make sure you go into classes, the cafeteria and the administrative offices. Listen to what your tour guide points out. What is the culture of the school? What do they value? Are they focused on academics, extracurriculars, the physical plant or the football team?
2. Watch the people. Are students engaged? Are teachers actively helping students individually? Are people happy... or miserable?
3. Talk to a student. Ask him/her what are you working on? What have you learned about this subject?
4. When you are in classrooms, filter what you see through the lens of equity. Do boys and girls get called on equally? Does the seating chart appear to put a specific group of students together (for example... active boys in the back, or all the black students together?) Does the school do tracking where some students are not able to participate in academic classes?
5. Look at the physical aspects of the school. What is on the walls? What information greets you as you enter the building? Is there a metal detector? Is it an athletic awards cabinet? Or is it about academic achievements? Colleges attended? Graduates and Alumni? Is the school clean? Go into a bathroom. See if it is well maintained.
6. Talk to neighbors who had students who recently went through the school. How were their children prepared? Ask their children about their experience. Ask them if they had to do it over again would they send their child to the school.
7. Observe the school cafeteria or end of the day dismissal. Watch how the school handles students in transition. Is there adequate guidance? Are the students responsible and well behaved or is it pandemonium?
8. Ask about Special Education. Does the school do a pull out or an inclusion program? Ask about the transition planning for high school juniors/seniors who have an IEP. See if you can talk to the Special Education coordinator.
9. Look at the assignments and notes on the board. Look at the vocabulary. Look at the problem sets. Is the focus on simple minded basic skills or is it challenging work? Is there an indication that students work on in depth projects?
10. Look at the state test scores for all subgroups. This means don't just look at how the school did as a whole. But look at how Title I students did, or Special Education students did, or students of color. Look at achievement gaps.
11. Talk to the Principal. See if he/she talks about what the school has to offer or whether the focus is on how the school measures its success... with all students.
12. Find out what kind of Support Services are offered. Is there a nurse, social workers, college counselors, a place for students to seek out help?
Measuring quality is very important. Simplifying it to a single number or a test score is foolish. Whether we like it or not, our society expects parents to choose the best for their children; no matter what the child's circumstances. Assuming that you can send your students to the local community school and receive a quality education is not guaranteed.
All schools are not equal.